Optimizing Performance Testing with JMeter: A Comprehensive Guide with Code Examples
- September 18, 2023
- Posted by: Alex
- Category: blog

In the fast-paced world of software development, ensuring your applications perform well under various conditions is paramount. Apache JMeter, a powerful open-source tool, has emerged as a go-to solution for performance testing, enabling developers to assess the scalability and reliability of their applications. In this article, we’ll delve into the depths of JMeter and provide you with practical code examples to elevate your performance testing efforts.
Understanding JMeter and Its Importance
Apache JMeter is a versatile tool designed for load testing, stress testing, and performance measurement of web applications. It allows developers to simulate real-world scenarios by creating test plans that mimic user interactions, helping identify bottlenecks, potential issues, and areas for optimization. JMeter’s flexibility and ability to test various protocols make it a preferred choice for performance testing.
Getting Started with JMeter
To embark on your JMeter journey, follow these steps:
Download and Install JMeter:
Visit the official Apache JMeter website, download the latest version, and install it on your machine.
Create a Test Plan:
JMeter operates based on test plans that define the scenarios you want to simulate. A test plan may include thread groups (users), samplers (requests), and listeners (results).
Add Thread Groups and Samplers:
Thread groups simulate the number of users, while samplers represent HTTP requests or other types of actions.
Configure Listeners:
Listeners capture and display test results. They help you analyze the performance metrics generated during testing.
Key Features and Code Examples
Let’s explore some of JMeter’s key features and provide code examples for each:
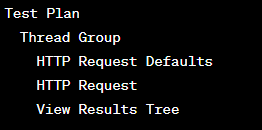
1. Creating a Test Plan:
A basic test plan might involve simulating user visits to a website.
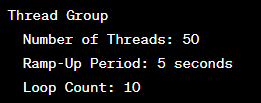
2. Configuring Thread Groups:
Thread groups define the number of users, ramp-up time, and loop count.
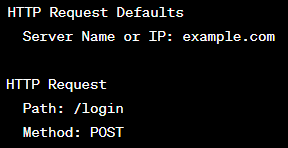
3. Adding HTTP Requests:
HTTP requests simulate user actions on your web application.
4. Viewing Test Results:
Listeners help you visualize and analyze test results.

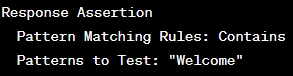
5. Configuring Assertions:
Assertions validate the responses received during testing.
6. Running and Analyzing Tests:
Execute your test plan and observe the results in listeners.
Conclusion
Apache JMeter has redefined performance testing by providing developers with a robust tool to analyze their applications’ scalability, stability, and responsiveness. Its intuitive interface, thread management, and support for various protocols make it an invaluable asset for any development team. By integrating JMeter into your testing workflow, you can identify performance bottlenecks, optimize applications, and deliver a seamless user experience to your audience, ultimately ensuring the success of your software in the dynamic digital landscape.